HiPiler

Visual exploration
of large genome interaction matrices
with interactive small multiples.

Live Demo

HiPiler is an interactive web application for exploring and visualizing many features in large genome interaction matrices. Genome interaction matrices approximate the physical distance of pairs of genomic regions to each other and can contain up to 3 million rows and columns. Traditional matrix aggregation or pan-and-zoom interfaces largely fail in supporting search, inspection, and comparison of local features. HiPiler represents features as thumbnail-like snippets. Snippets can be laid out automatically based on their data and meta attributes. They are linked back to the matrix, visualized with HiGlass, and can be explored interactively.

News

  1. Fritz presented HiPiler at the Hi-C Data Analysis Bootcamp from Harvard, MIT, and UMassMed. [Slides] May 8th, 2018
  2. Nils presented HiPiler among other tools at Visualizing Biologival Data (VIZBI) 2018. [Slides] Mar 28th, 2018
  3. Nils presented HiPiler at Dana-Farber's Center for Functional Cancer Epigenetics. Mar 2nd, 2018
  4. Version 1.2 is out, supporting five color maps with custom color scaling and featuring HiGlass version 0.10.11 among other things. Jan 21st, 2018
  5. Nils talked about HiPiler at Harvard's 2017 PQG Conference. [Slides] Nov 2nd, 2017
  6. Fritz presented HiPiler at Microsoft's Computational Aspects of Biological Information 2017. [Poster] Oct 13th, 2017
  7. Fritz presented HiPiler at IEEE VIS in Phoenix at InfoVis. [Presentation | Slides] Oct 5th, 2017
  8. Fritz was invited to pitch HiPiler at Harvard - Novartis Machine Learning and Computational Meeting. Sep 22nd, 2017
  9. Nature published an entire blog post about HiPiler. Sep 11th, 2017
  10. Fritz demonstrated HiPiler at 4D Nucleome Annual Meeting 2017. [Slides | Poster] Sep 7th, 2017
  11. HiPiler got accepted at IEEE VIS (InfoVis). Jul 11th, 2017

Screencast

Introduction

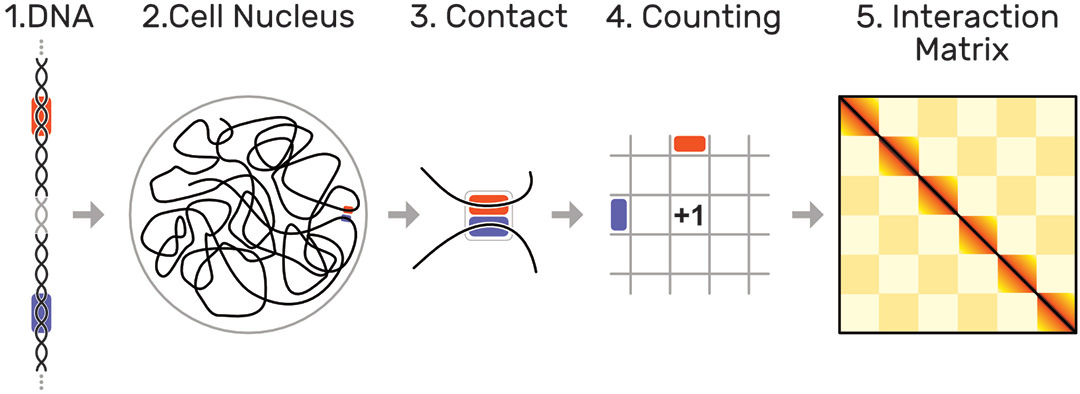
The human genome is about 2 meters long and tightly folded into each cell nucleus. This results in a dense, fractal-like and three-dimensional structure in which genome sequences that are distant on the genome, can be in close spatial proximity. It has been shown [1] that this 3D structure is an important factor for regulation of gene expression, replication, DNA repair, and other biological functions. Biologists are interested in uncovering the mechanisms that drive global and local folding to better understand the vast and complex gene regulation network.

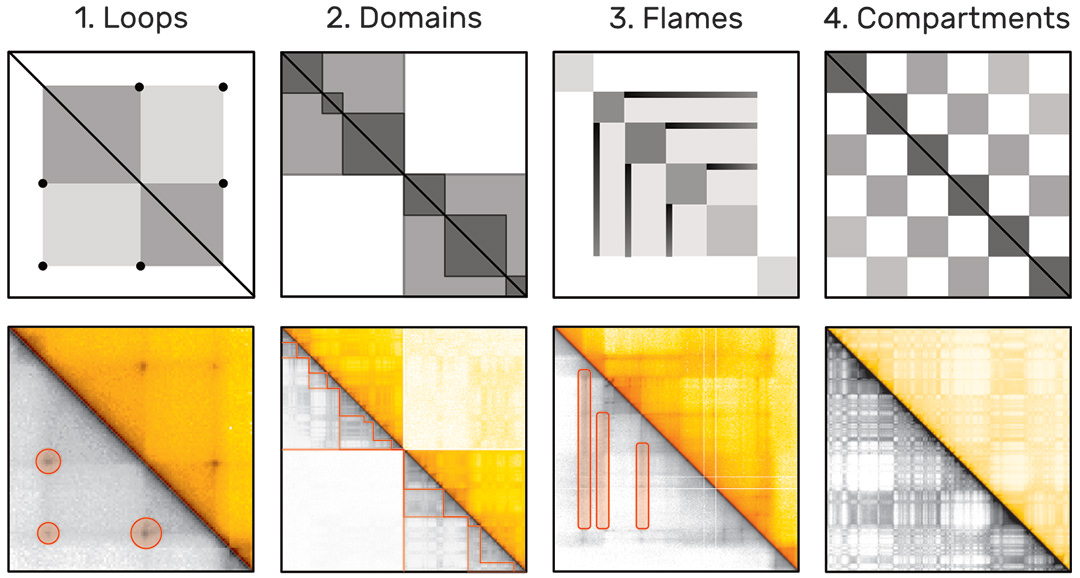
The probability of two sequences being in close proximity to each other, i.e. interacting, can be inferred using modern genome sequencing techniques, which yield for every genome a huge symmetric genome interaction matrix with up to 3 million rows and 3 million columns (Fig. 1). Each of the 9 trillion matrix cells represents the proximity of two genomic regions. Repetitive and hierarchically nested visual patterns (Fig. 2), ranging from millions down to a few thousand base pairs in size, can be identified across the matrix, which represent so called regions of interest (ROIs).

Fig. 1: Hi-C
Fig. 1: Hi-C methodology: as the DNA (1) is organized non-arbitrarily in the cell nucleus (2), certain parts (highlighted in orange and blue) are frequently in close contact (3). These contacts are quantified over a set of several hundred million cells (4), leading to interaction matrix of up to 3 by 3 million cells (5). Dark colors indicate more frequent contact occurrences of two loci.
Fig. 2: Hi-C Patterns
Fig. 2: Examples of frequent patterns by increasing size. Loops (1) appear as dark central dots. Hierarchically-organized domains (2) are darker rectangles. Flames (3) are horizontal or vertical lines. Active and inactive compartments create a global checkerboard pattern (4).

Algorithms for automatic pattern detection are being development. However, these algorithms can be very complex and often identify tens of thousands of pattern instances. Results of algorithms designed to identify the same type of pattern often differ substantially [2] and the lack of a ground-truth pattern collection hinders thorough evaluation of these algorithms.

Interactive visualization tools have been developed [3] but are focused on supporting visualization of a single or a small number of views of the matrix and navigation through pan and zoom [4, 5]. Detailed exploration and comparison of thousands of small ROIs is unsupported by current tools yet needed, due to the size and multiscale nature of the folded genome.

HiPiler is an interactive visualization tool designed for exploration and analysis of thousands of ROIs extracted from one or more genome interaction matrices.

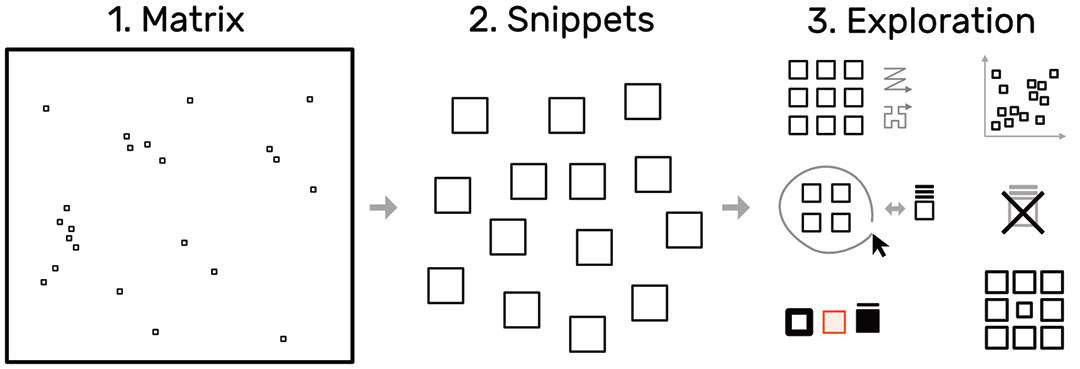
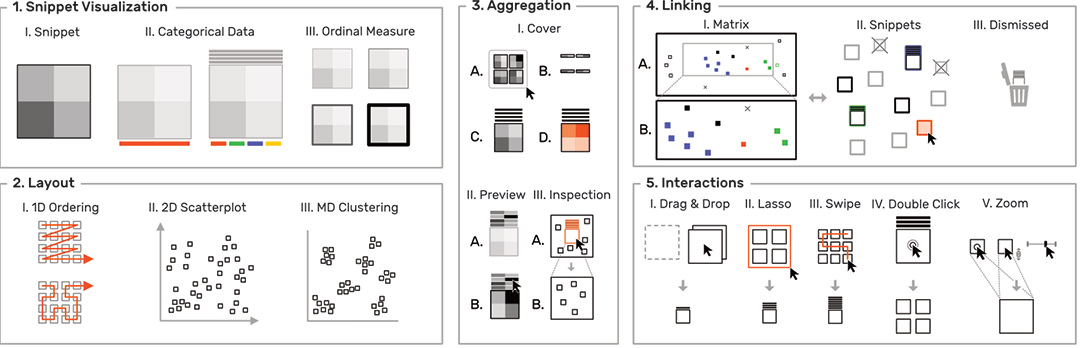
To overcome the contextual constraints of exploring local patterns in large matrices, HiPiler follows a divide and explore approach that extracts ROIs from the matrix and enables independent exploration (Fig. 3). HiPiler assumes a given set of ROIs, derived from specialized pattern recognition algorithms. HiPiler then visualizes these ROIs as small heatmaps (matrices) which we call snippets. A snippet is associated with a set of ordinal and categorical attributes, such as its noisiness, size, or source dataset. This data is derived from the matrix itself or point to prior knowledge. Based on this data, HiPiler enables automatic and manual ordering, positioning, grouping, filtering, and visual manipulation to identify patterns present across the set of snippets. Additionally, the context of snippets in the matrix is maintained through highlighting of snippet locations in the interaction matrix.

Fig. 3: The snippets approach.
Fig. 3: The snippets approach: decompose a large matrix (1) into small snippets (2) and explore these snippets (3) using different layouts, arrangements, and styles, while maintaining global context.

The design of HiPiler (Fig. 4) is informed by semi-structured interviews with ten domain experts from various genomics research labs as well as iterative design sessions over the course of several months. These interviews led to the formulation of six tasks for the exploration of many ROIs in large matrices.

Fig. 4: Design of visualization and interaction concepts in HiPiler.

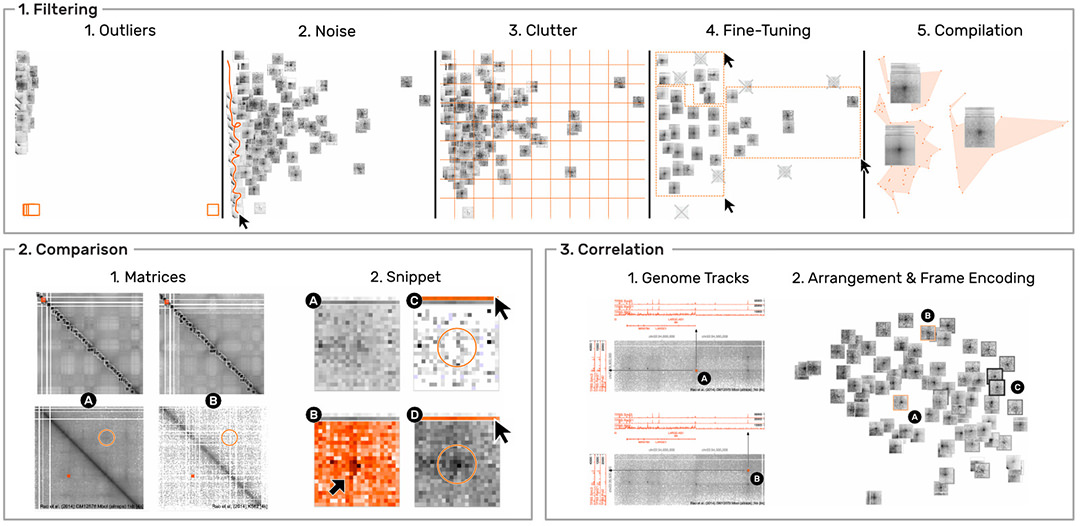
HiPiler is designed to support four types of scenarios. (i) visual evaluation of the results of pattern detection algorithms. (ii) characterization, aggregation, and outlier detection in large pattern collections (Fig. 5.1). (iii) comparison of ROIs across multiple matrices (Fig. 5.2), e.g., to compare different datasets, experimental conditions, or extraction algorithms.

And (iv) correlation of matrix patterns with other genomic attributes (Fig. 5.3), e.g., genes or protein-binding sites. We evaluated the usability and appropriateness of HiPiler through a user study with five domain experts. The results show that HiPiler is easy to learn and use, and that it offers important benefits for analyzing genome interaction matrices.

Fig. 5: Design of HiPiler
Fig. 5: Illustrations on how HiPiler supports (1) filtering and grouping, (2) comparison, and (3) correlation.

Publication

  1. HiPiler: Visual Exploration Of Large Genome Interaction Matrices With Interactive Small Multiples

    1. Fritz Lekschas
    2. Benjamin Bach
    3. Peter Kerpedjiev
    4. Nils Gehlenborg
    5. Hanspeter Pfister
    IEEE Transactions on Visualization and Computer Graphics (InfoVis), 24, 1, 522-531, 2018.

Presentations

For VIS researchers:
For biomedical researchers:

IEEE VIS InfoVis, Phoenix, 2017

4D Nucleome Annual Meeting, Bethesda, 2017

Source Code

All the code of HiPiler are publicly accessible and open-source.

Authors

  1. Fritz Lekschas

    Harvard John A. Paulson School of Engineering and Applied Sciences

  2. Benjamin Bach

    University of Edinburgh

  3. Peter Kerpedjiev

    Harvard Medical School

  4. Nils Gehlenborg

    Harvard Medical School

  5. Hanspeter Pfister

    Harvard John A. Paulson School of Engineering and Applied Sciences

References

  1. [1] Fraser and Bickmore. (2017) Nuclear organization of the genome and the potential for gene regulation. Nature, 447, 7143, 413–417.
  2. [2] Forcato et al. (2017) Comparison of computational methods for Hi-C data analysis. Nature methods 14, 7, 679.
  3. [3] Yardımcı and Noble. (2017) Software tools for visualizing Hi-C data. Genome Biology, 18, 1, 26.
  4. [4] Durand et al. (2016) Juicebox provides a visualization system for Hi-C contact maps with unlimited zoom. Cell Systems, 3, 1, 99–101.
  5. [5] Kerpedjiev et al. (2017) HiGlass: Web-based visual comparison and exploration of genome interaction maps. bioRxiv.